
Reporting

The numbers you own. Reconciled to the penny.

Dashboard KPIs, per-event breakdowns, and transaction CSVs—all anchored on sale date.

Get started
Reporting
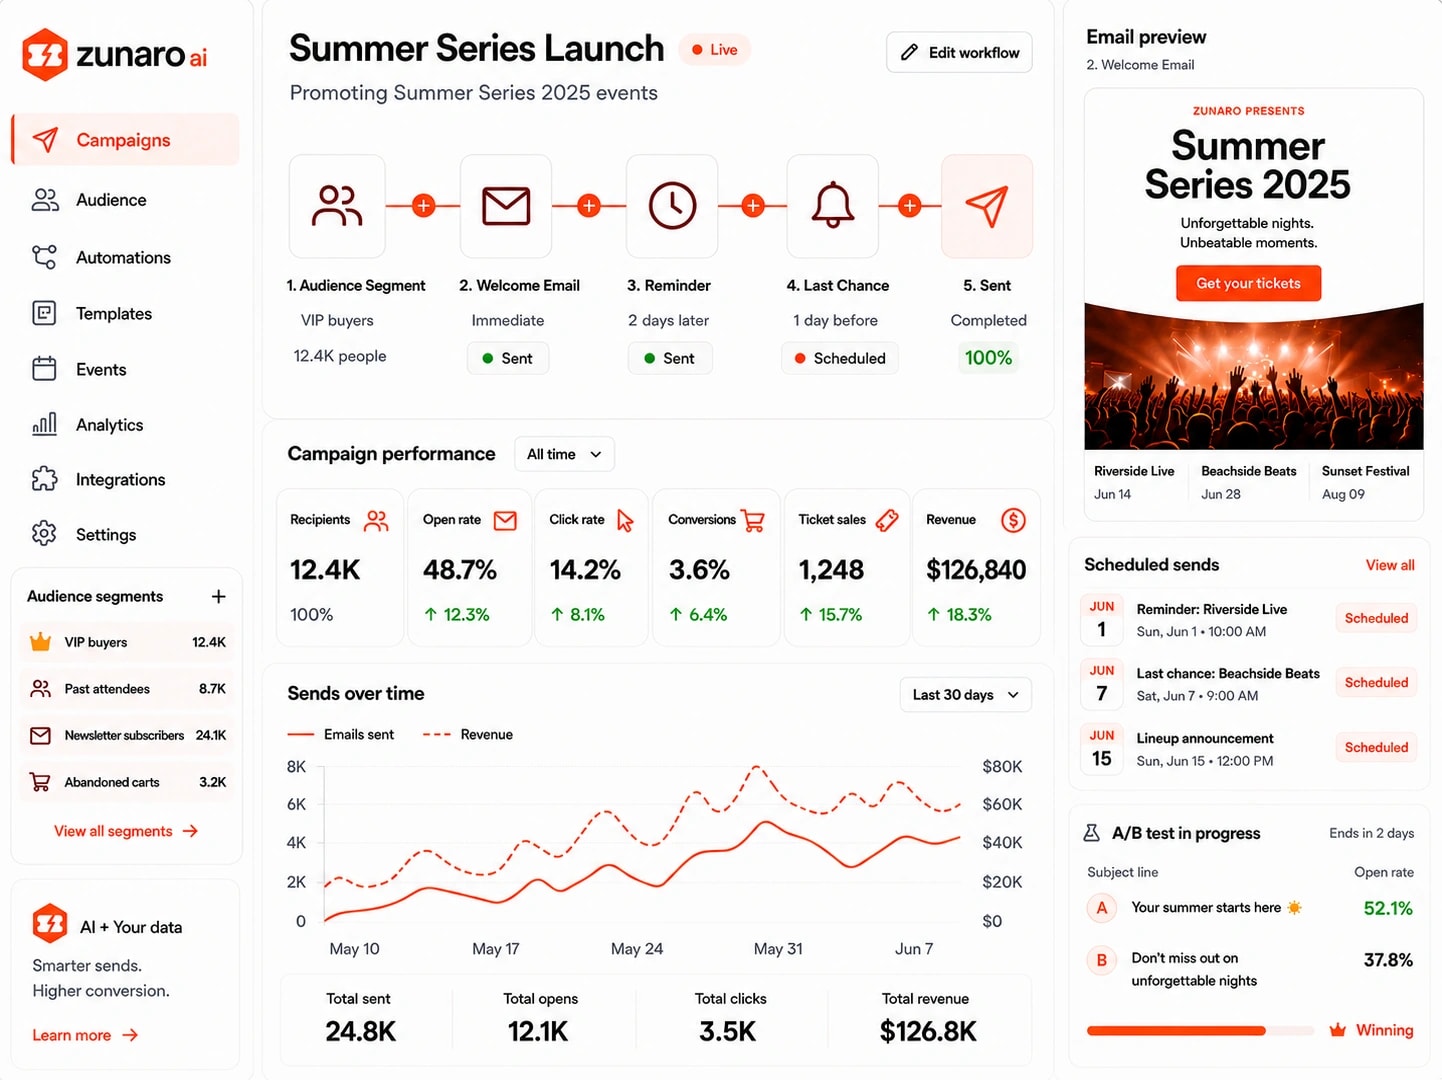
Zunaro campaigns dashboard for a Summer Series Launch — a multi-step workflow from audience segment to sent, campaign performance metrics (open rate, click rate, conversions, ticket sales, revenue), a sends-over-time chart, audience segments, an email preview, scheduled sends and an A/B test in progress

The clarity layer for organizers.

Dashboard at a glance.

Gross, refunds, net, order count, and AOV bucketed by day, week, or month with time presets and multi-currency grouping.

Reporting
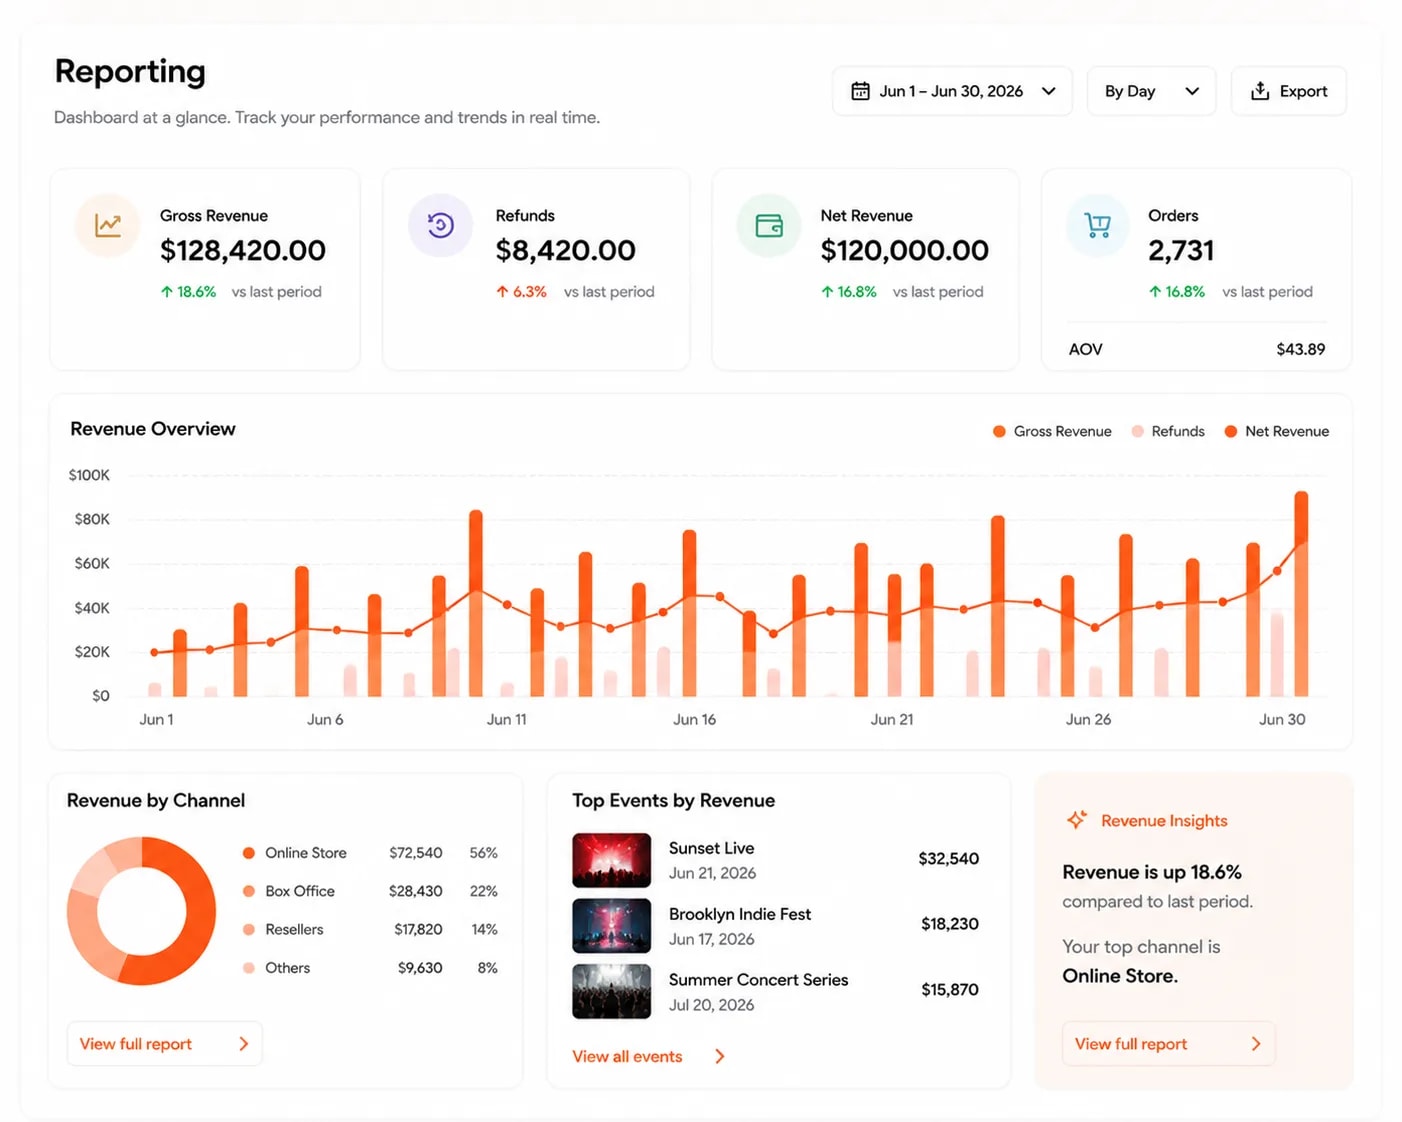
A reporting dashboard over a chosen date range — gross revenue, refunds, net revenue and order count each compared with the last period, average order value, a daily revenue chart plotting gross, refunds and net together, revenue split by channel, top events by revenue, and an insight naming the strongest channel

Per-event revenue rows.

Drill from gross revenue into each event's ticket count, refunds, and net by currency—no order spans, no reconciliation gaps.

Reporting
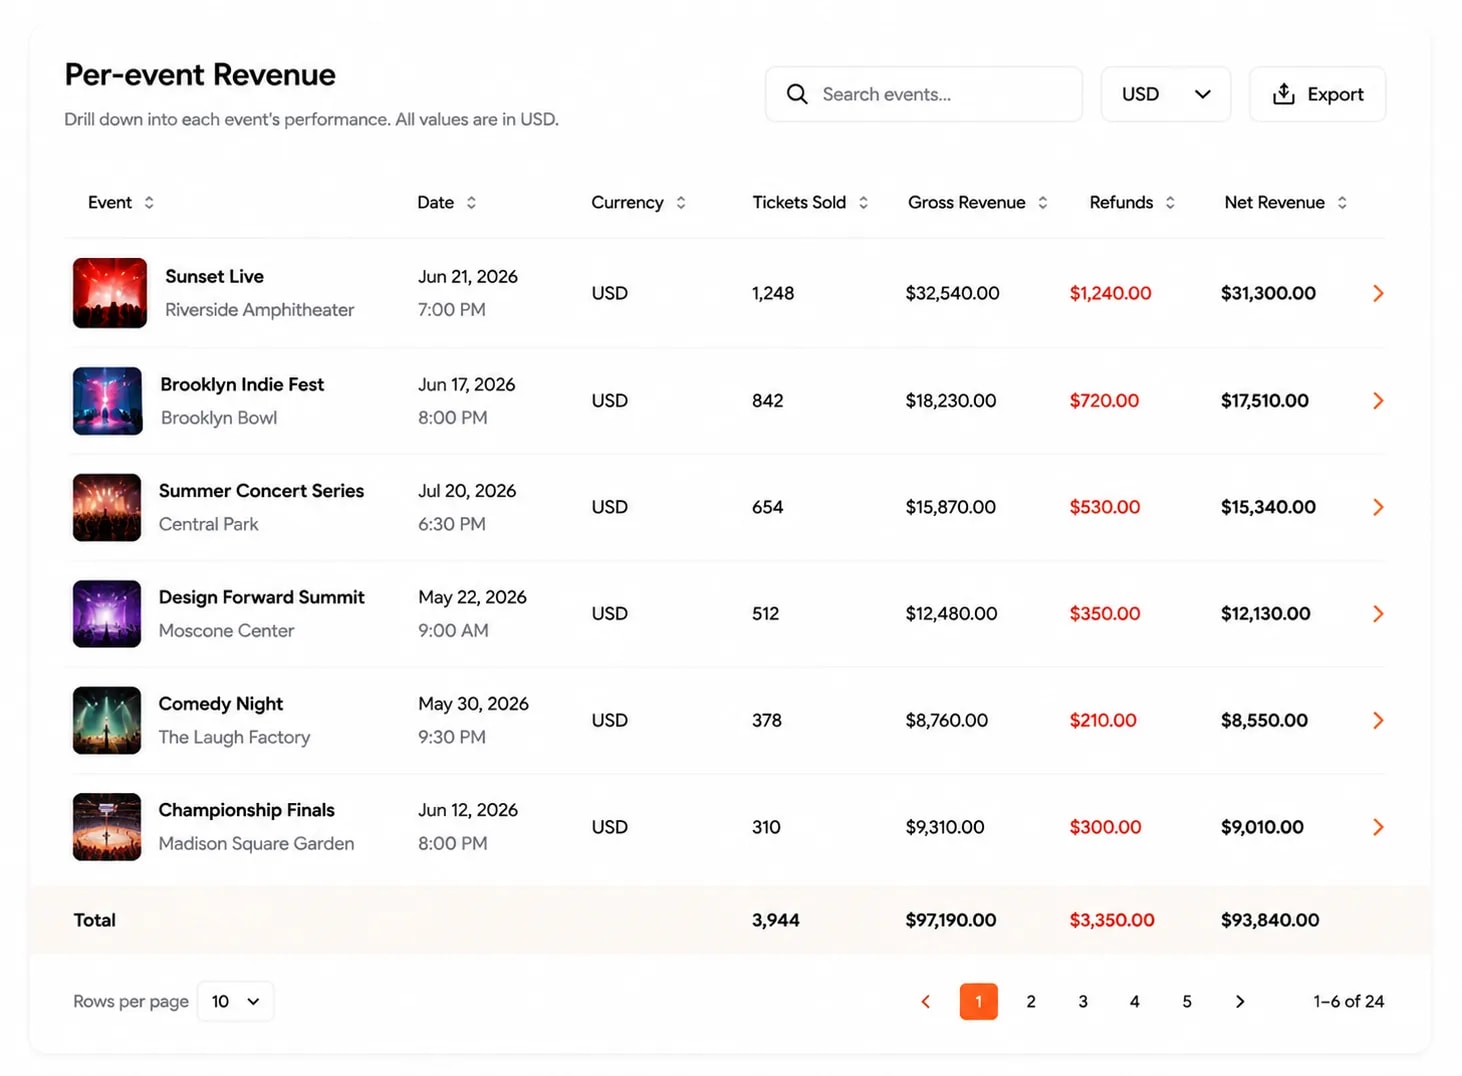
A sortable per-event revenue table — each event with its date, currency, tickets sold, gross revenue, refunds and net revenue, drillable row by row, with a totals row summing tickets, gross, refunds and net across all events

Transaction ledger.

Every order: buyer, email, number, date, status, channel, total, tenders—paginated, filterable, exported to CSV for your accountant.

Reporting
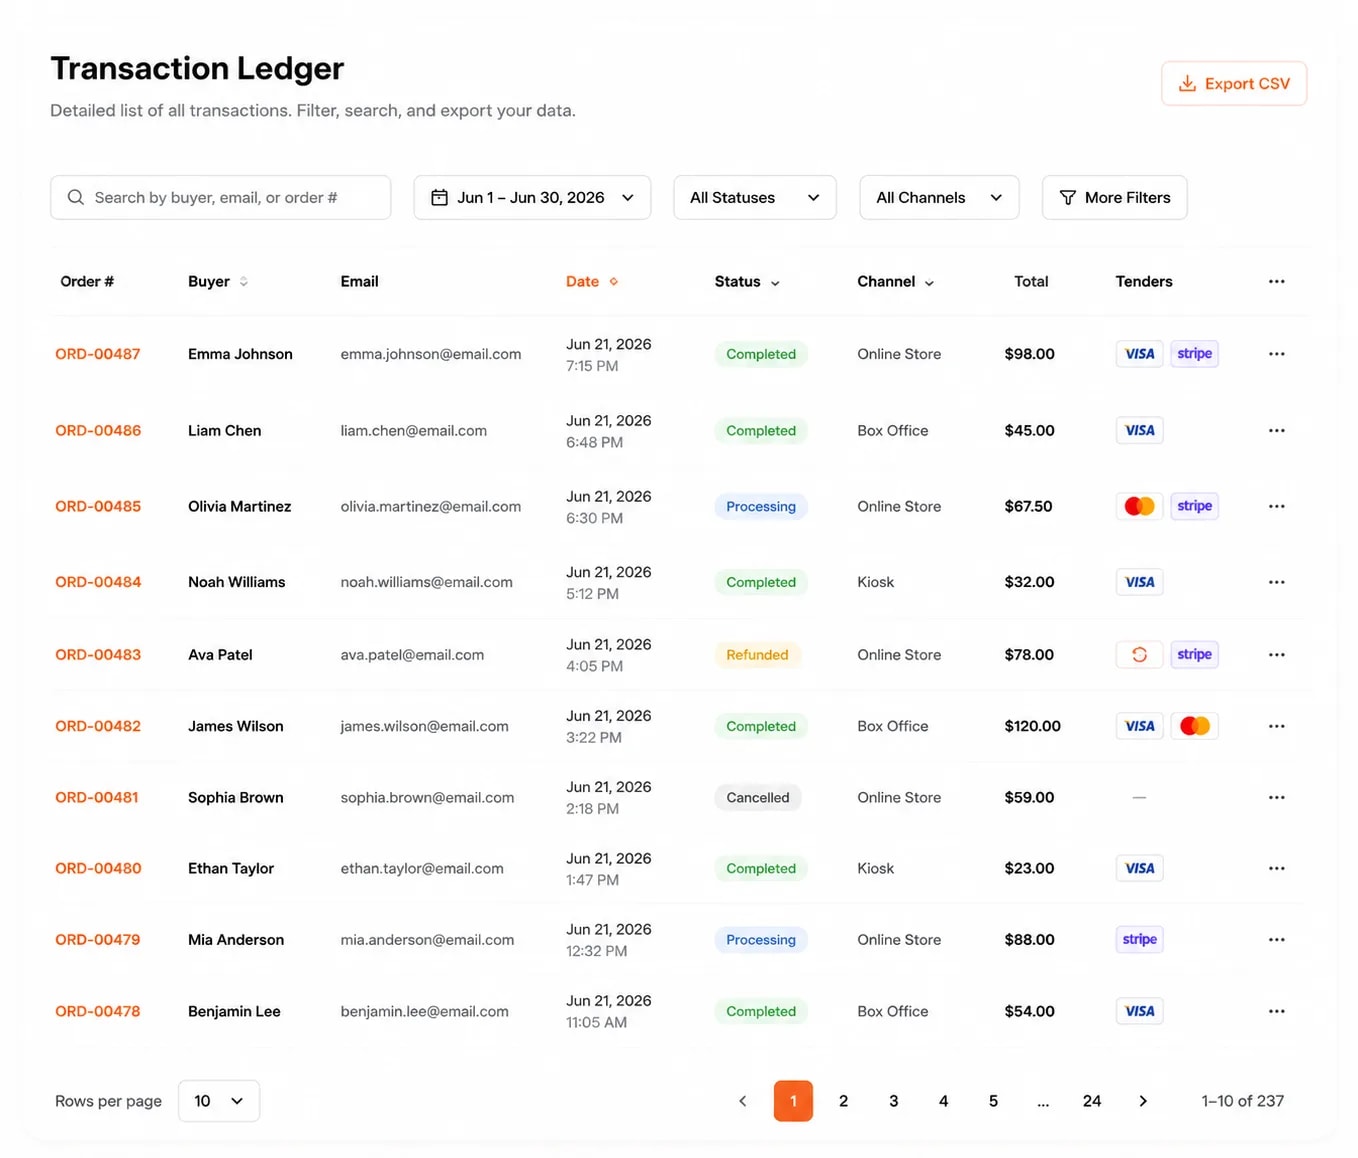
A paginated transaction ledger listing every order with its number, buyer, email, date, status, channel, total and card tenders — filterable by date range, status and channel, searchable by buyer, email or order number, and exportable to CSV

Refund math that sticks.

Dashboard, per-event rows, and transaction detail all read one ledger—refunds sum from ticket lines, anchored on original sale date, charts never drift.

Reporting
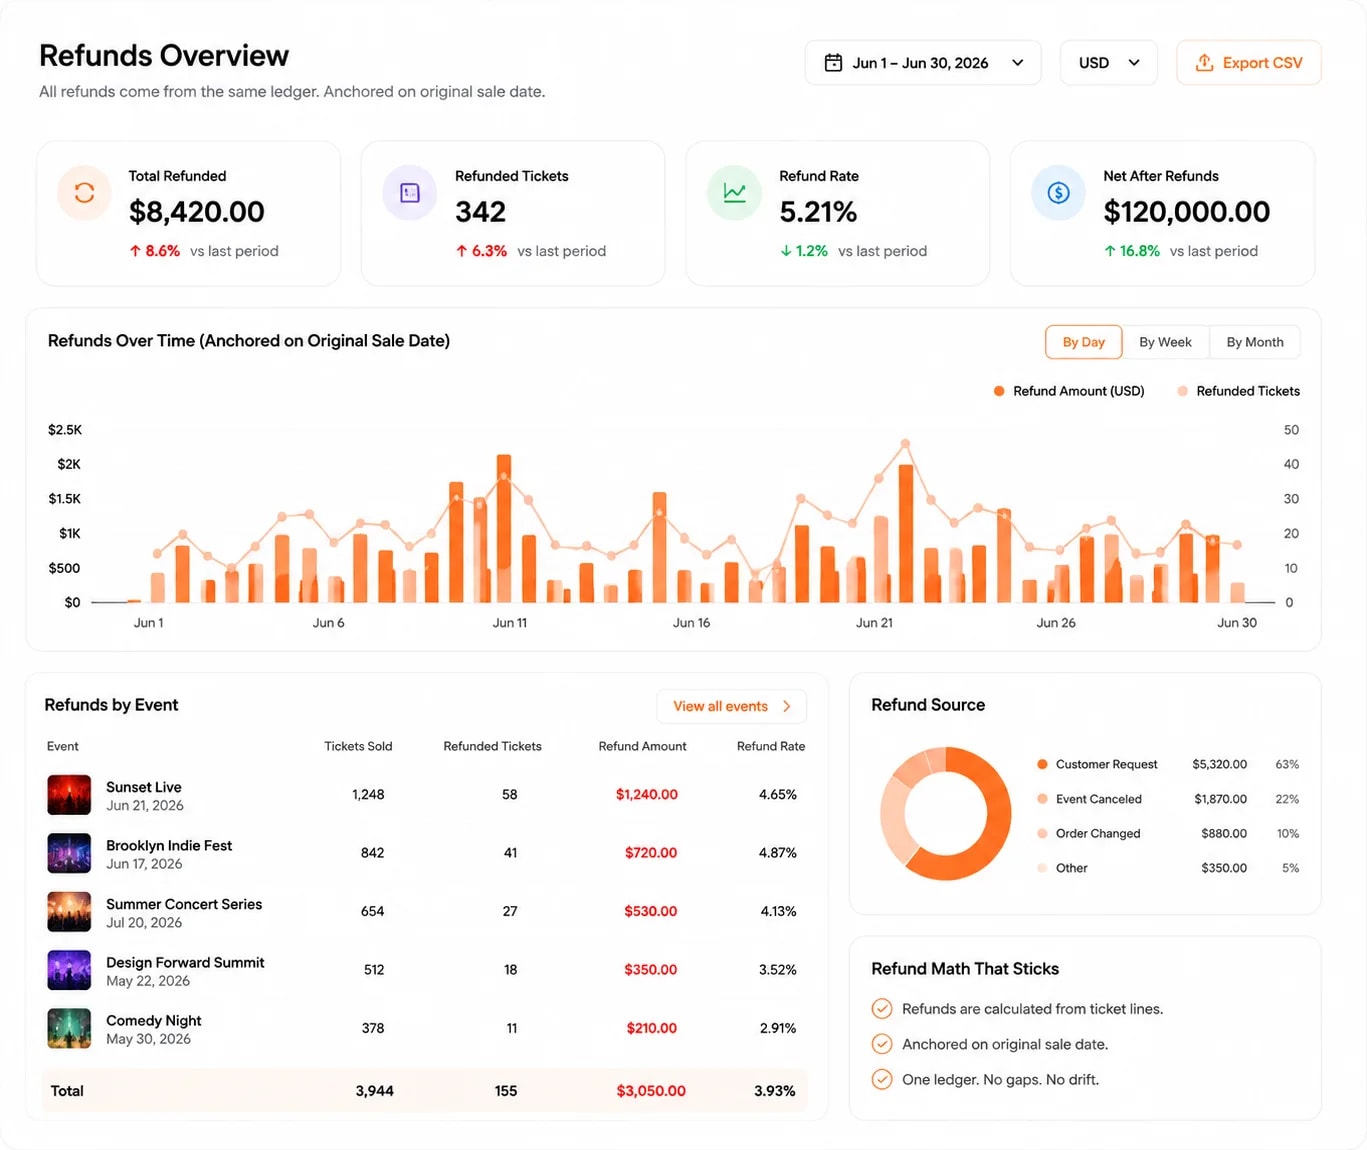
A refunds overview reading the same ledger — total refunded, refunded tickets, refund rate and net after refunds, a refunds-over-time chart anchored on the original sale date, refunds broken out per event with their rates, refund reasons by share, and a note that refunds are calculated from ticket lines with no gaps or drift

Start with 14 days of Premium, for free.